How to read a Lighthouse report without panicking
A practical guide to understanding what matters in your performance audit—and what you can safely ignore

Table of contents
- The first rule: your score is not your site
- What to read first: Core Web Vitals
- Opportunities vs. diagnostics: know the difference
- The audits you can usually ignore
- What to do when everything is red
- Lab data vs. field data: the reality check
- When to re-run Lighthouse
- The tools that help you act on Lighthouse findings
- Key takeaways
- FAQ
- Sources
The first rule: your score is not your site
Open a Lighthouse report for the first time and you're met with a wall of numbers, color-coded boxes, and warnings about things you've never heard of. The natural response is panic. The score is red. There are seventeen failed audits. Surely the site is broken?
It probably isn't. Lighthouse is a diagnostic tool, not a report card. The score is a synthetic benchmark run under lab conditions—often on a throttled connection, simulating a mid-range phone from 2017. It tells you how your site performs in that specific scenario, not how real users experience it in the wild.
This matters because most teams fixate on the score and miss the context. A score of 65 might be fine for a complex web app with real-time data. A score of 95 might still deliver a poor experience if the wrong things are optimized. The score is a starting point for investigation, not a success metric.
What to read first: Core Web Vitals

Skip the overall performance score. Scroll down to the Metrics section and look at three numbers: Largest Contentful Paint (LCP), Cumulative Layout Shift (CLS), and Interaction to Next Paint (INP). These are the Core Web Vitals, and they're the only performance metrics Google uses as a ranking signal.
- LCP measures how long it takes for the largest visible element to render. Target: under 2.5 seconds. If you're over 4 seconds, users are waiting too long to see meaningful content.
- CLS measures visual stability—how much the page jumps around as it loads. Target: under 0.1. If you're over 0.25, users are accidentally clicking the wrong thing because buttons moved.
- INP measures responsiveness—how quickly the page reacts to clicks, taps, and keystrokes. Target: under 200ms. If you're over 500ms, the site feels sluggish.
These three metrics correlate with actual user frustration. Fix these before you worry about anything else.
Opportunities vs. diagnostics: know the difference
Lighthouse splits its findings into two categories: Opportunities and Diagnostics. Opportunities are ranked by estimated time savings. Diagnostics are additional context—things that might be problems, or might not.
Start with Opportunities. If Lighthouse says "Eliminate render-blocking resources" could save 1.2 seconds, that's a concrete win. If it says "Reduce unused JavaScript" could save 0.1 seconds, it's probably not worth the refactor.
Diagnostics are trickier. "Avoid an excessive DOM size" sounds bad, but if your CLS is fine and your INP is fast, a large DOM might not be hurting anyone. Diagnostics are clues, not mandates. Investigate the ones that align with your actual metrics.
The audits you can usually ignore
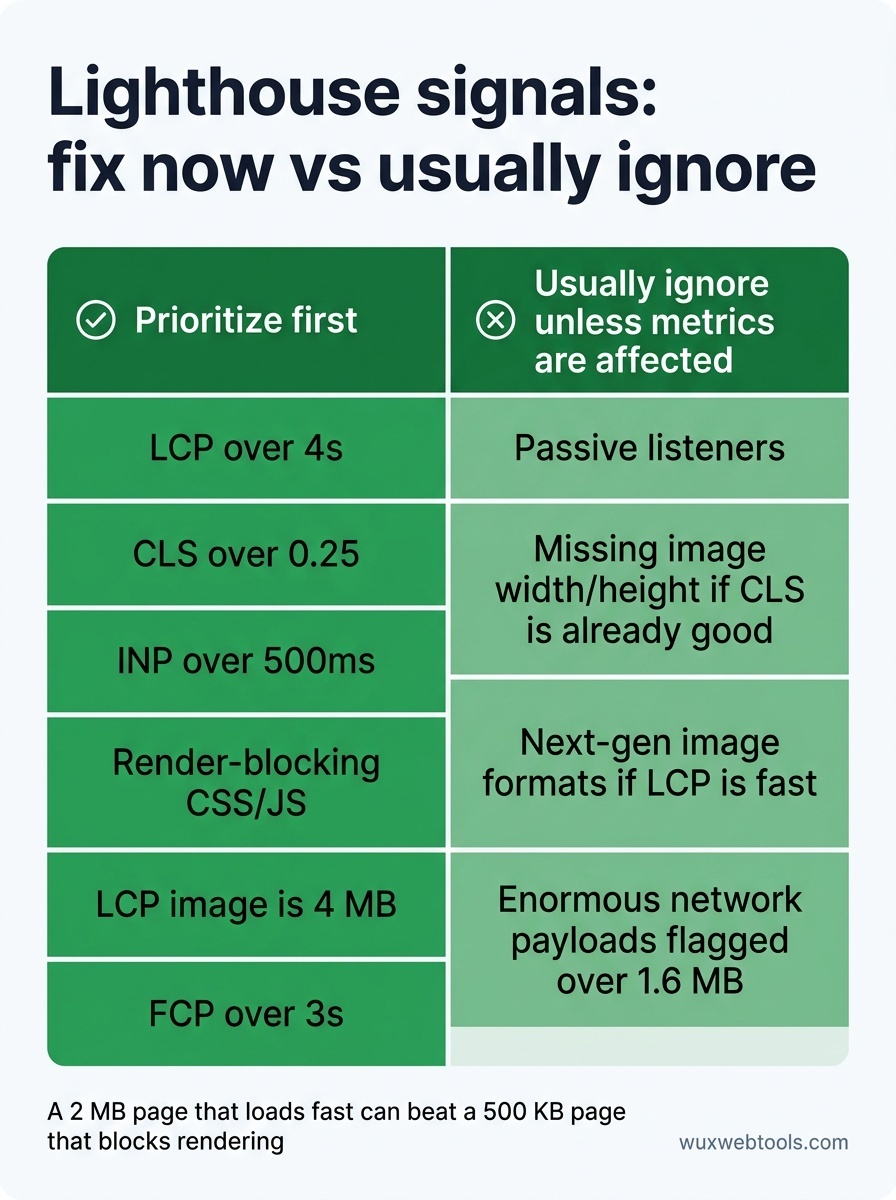
Some Lighthouse warnings are vestigial or overly aggressive. Here are the ones that cause the most unnecessary panic:
- "Does not use passive listeners to improve scrolling performance" — This is a micro-optimization that rarely moves the needle. Unless you have evidence of janky scrolling, skip it.
- "Image elements do not have explicit width and height" — This matters for CLS, but only if images are causing layout shifts. If your CLS is already good, don't refactor for the sake of the audit.
- "Serve images in next-gen formats" — Yes, WebP and AVIF are smaller. But if your images are already optimized and your LCP is fast, this is a nice-to-have, not a crisis.
- "Avoid enormous network payloads" — Lighthouse flags anything over 1.6 MB. But a 2 MB page that loads fast is better than a 500 KB page that blocks rendering. Focus on how the bytes are delivered, not just the total.
What to do when everything is red
If your Lighthouse score is below 50 and most audits are failing, you're probably dealing with one of three root causes:
- Unoptimized fonts. Web fonts are still the easiest performance win on most sites. Check if you're loading six font weights when you only use two, or shipping WOFF files instead of WOFF2.
- Render-blocking CSS and JavaScript. If your First Contentful Paint (FCP) is over 3 seconds, something is blocking the browser from painting. Look for large CSS files or synchronous scripts in the
<head>. - Oversized images. If your LCP element is an image and it's 4 MB, that's your problem. Compress it, lazy-load below-the-fold images, and use responsive image syntax.
Fix one of these and re-run Lighthouse. You'll often see a 20-30 point jump. Then tackle the next one.
Lab data vs. field data: the reality check
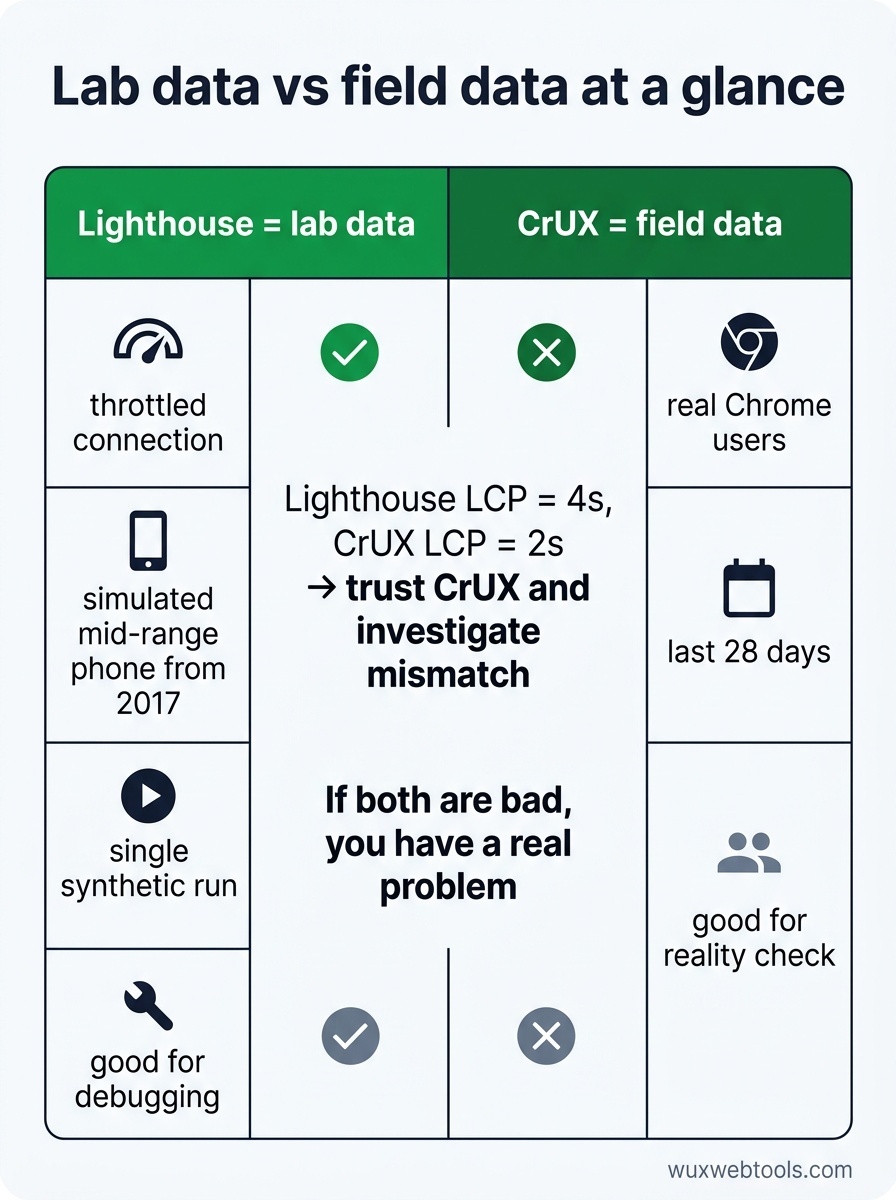
Lighthouse runs in a lab. It simulates a slow connection and a slow device, but it can't simulate real user behavior—how people scroll, what they click, whether they're on flaky Wi-Fi.
For a reality check, compare your Lighthouse results to field data from the Chrome User Experience Report (CrUX). CrUX shows how real Chrome users experience your site over the last 28 days. If Lighthouse says your LCP is 4 seconds but CrUX shows 2 seconds, trust CrUX. If they're both bad, you have a real problem.
You can find CrUX data in PageSpeed Insights (the web version of Lighthouse) or in Google Search Console under "Core Web Vitals." If there's a mismatch, investigate why. Maybe your real users are on faster networks. Maybe Lighthouse is testing an unoptimized dev build.
When to re-run Lighthouse
Lighthouse is noisy. Run it three times in a row and you'll get three different scores, even on the same page. This is because performance is variable—background processes, network jitter, and browser heuristics all affect the result.
To get a stable baseline, run Lighthouse in incognito mode with all extensions disabled, or use the CLI with the --preset=desktop flag for more consistent results. Run it three times and average the scores. If you're seeing wild swings (more than 10 points), something else is wrong—maybe the server is slow, or the page is loading different resources each time.
Re-run Lighthouse after every significant change. Deploy a new font strategy? Check LCP. Lazy-load images? Check CLS. Add a third-party script? Check INP. Performance is not a one-time fix; it's a budget you defend.
The tools that help you act on Lighthouse findings
Lighthouse tells you what is slow. It doesn't always tell you how to fix it. For that, you need additional tools:
- WebPageTest gives you a filmstrip view of how the page loads, frame by frame. Essential for diagnosing LCP and CLS issues.
- Chrome DevTools Performance panel shows you exactly which JavaScript is blocking the main thread. Use it to find the source of a bad INP score.
- Image compressor tools let you optimize images directly in the browser, which is faster and more private than uploading to a third-party service. Client-side image processing is a privacy win because your images never leave your machine.
Lighthouse is the starting point. These tools help you finish the job.
Key takeaways
- Your Lighthouse score is a lab benchmark, not a measure of real-world user experience. Compare it to field data from CrUX before you panic.
- Focus on Core Web Vitals (LCP, CLS, INP) first. These are the metrics that correlate with user frustration and SEO impact.
- Prioritize Opportunities by estimated time savings. Ignore Diagnostics that don't align with your actual performance problems.
- Some audits—like passive listeners or next-gen image formats—are micro-optimizations. Fix the big things first.
- Run Lighthouse three times and average the results. Performance is variable, and a single run can be misleading.
FAQ
Q: Why does my Lighthouse score change every time I run it?
A: Lighthouse measures performance under variable conditions—network speed, CPU load, and browser heuristics all affect the result. Run it three times in incognito mode and average the scores for a more stable baseline.
Q: Should I optimize for mobile or desktop first?
A: Mobile. Lighthouse defaults to a mobile simulation because most web traffic is mobile, and mobile devices are slower. If your mobile score is good, your desktop score will usually be fine.
Q: My Lighthouse score is 95, but my site still feels slow. What's wrong?
A: Lighthouse measures page load, not interactivity after load. Check your INP score and use the Chrome DevTools Performance panel to profile what happens when users click or scroll. You might have a JavaScript problem that Lighthouse doesn't catch.
Q: Do I need a perfect 100 score?
A: No. A score of 90+ is excellent. Chasing 100 often means optimizing things that don't matter to users. Focus on real metrics—LCP, CLS, INP—and ignore the score.
Q: Can I trust Lighthouse if I'm using a lot of third-party scripts?
A: Lighthouse will flag third-party scripts as a problem, but it can't always distinguish between necessary and unnecessary ones. Use the "Avoid enormous network payloads" and "Reduce JavaScript execution time" audits to identify the worst offenders, then decide if they're worth keeping.
Sources
Frequently asked questions
Why does my Lighthouse score change every time I run it?
Should I optimize for mobile or desktop first?
My Lighthouse score is 95, but my site still feels slow. What's wrong?
Do I need a perfect 100 score?
Can I trust Lighthouse if I'm using a lot of third-party scripts?
Sources & further reading