Core Web Vitals explained: LCP, INP and CLS in plain English
A practical guide to what Google’s three user experience metrics actually measure, why they fail, and how to improve them without chasing scores blindly.
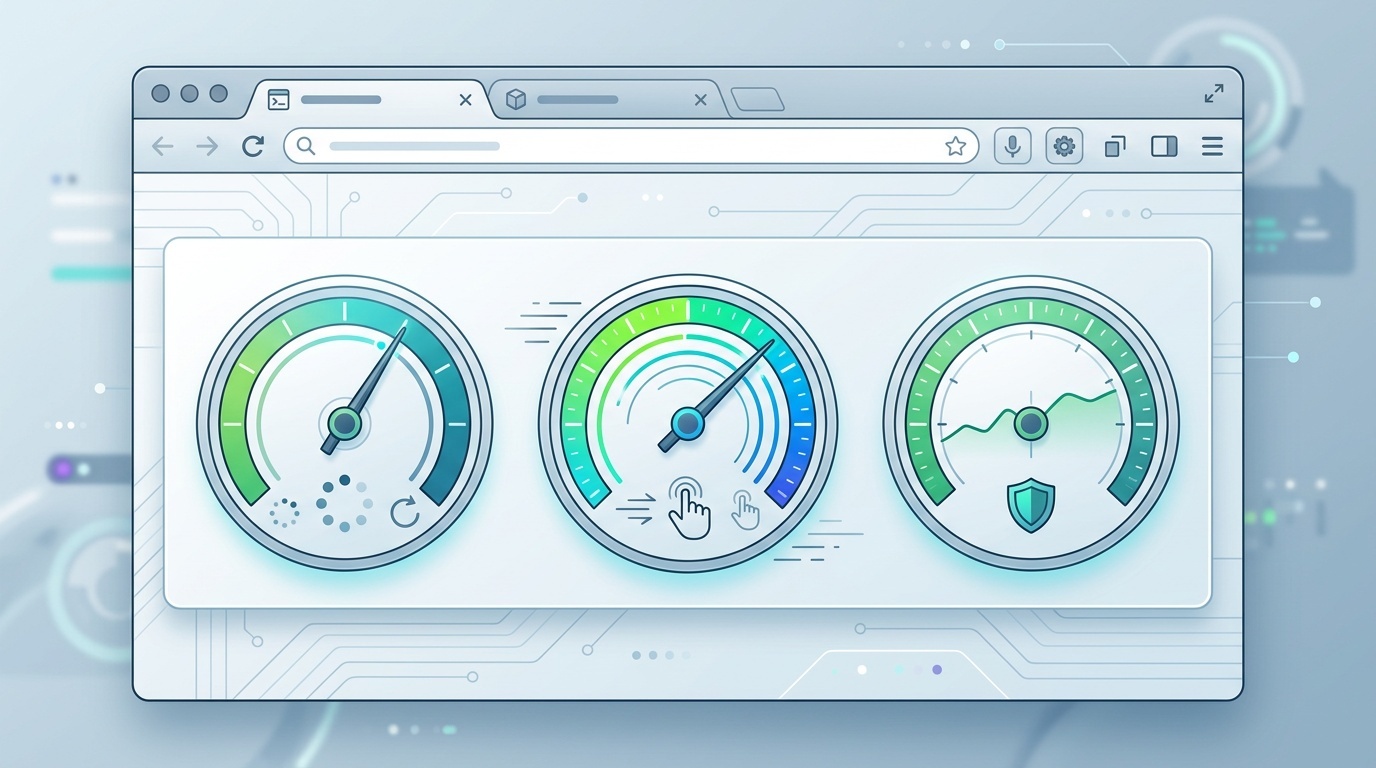
Table of contents
- Core Web Vitals are not a personality test for your website
- The three metrics in one sentence each
- LCP: when does the page feel loaded?
- Common causes of poor LCP
- How to improve LCP
- INP: does the page respond when touched?
- Common causes of poor INP
- How to improve INP
- CLS: does the page stay where the user expects?
- Common causes of poor CLS
- How to improve CLS
- Field data and lab data are both useful, but they answer different questions
- A sensible order of work
- What Core Web Vitals do not tell you
Core Web Vitals are not a personality test for your website
Core Web Vitals are often treated like a mysterious scorecard. A page gets a red number, someone posts a screenshot in Slack, and the team starts arguing about JavaScript frameworks.
That is not especially useful.
The better way to think about Core Web Vitals is simpler: they are three measurements of whether a page feels usable to a real person on a real device. They do not capture every aspect of performance, accessibility or quality. But they do catch three common sources of frustration:
- The main content takes too long to appear.
- The page reacts slowly when the user tries to do something.
- The layout jumps around while the user is reading or tapping.
Those are the three Core Web Vitals: LCP, INP and CLS.
Google uses them as part of its page experience signals, but the SEO angle is not the best reason to care. The better reason is that slow, jumpy, unresponsive pages waste users’ time. They also tend to convert worse, support worse, and age badly.
The three metrics in one sentence each
Before getting into details, here is the plain-English version:
- LCP, or Largest Contentful Paint, measures how long it takes for the main visible content to load.
- INP, or Interaction to Next Paint, measures how quickly the page responds to user interactions across the visit.
- CLS, or Cumulative Layout Shift, measures how much the page unexpectedly moves around.
The usual thresholds are:
| Metric | Good | Needs improvement | Poor | |---|---:|---:|---:| | LCP | 2.5s or faster | 2.5s–4.0s | Over 4.0s | | INP | 200ms or faster | 200ms–500ms | Over 500ms | | CLS | 0.1 or lower | 0.1–0.25 | Over 0.25 |
These numbers are normally evaluated at the 75th percentile of real user visits. That matters. You are not trying to make one perfect lab run. You are trying to make the experience good for most users, including people on slower phones and messier networks.
If you are staring at an automated report and unsure where to start, it helps to separate diagnosis from panic. We have a separate guide on how to read a Lighthouse report without panicking that covers that workflow in more detail.
LCP: when does the page feel loaded?
Largest Contentful Paint measures the render time of the largest visible content element in the viewport. In practice, that is often:
- a hero image,
- a large heading,
- a featured article image,
- a product image,
- a large block of text.
LCP is not asking when every script, tracking pixel and below-the-fold image finished loading. It is asking: when did the main thing the user came to see become visible?
That makes LCP a more human metric than old-fashioned “page load time”. A page can technically finish loading late but still feel fast if the main content appears quickly. The reverse is also true: a page can fire the load event while the hero area is still blank, blurred or blocked by a render delay.
Common causes of poor LCP
Most bad LCP problems come from a few predictable places:
- Slow server response
If the HTML document arrives late, everything else starts late.
- Render-blocking CSS or JavaScript
The browser has the content but cannot paint it yet.
- Unoptimised hero images
The largest element is too large, in the wrong format, not prioritised, or loaded lazily by mistake.
- Web fonts delaying text rendering
A large heading might be the LCP element, and font loading can delay or visually alter it.
- Client-side rendering delays
If the page needs a large JavaScript bundle before it can show meaningful content, LCP suffers.
How to improve LCP
Start with the actual LCP element. Do not optimise random assets until you know what the browser is measuring.
Practical fixes include:
- Serve HTML quickly: cache where appropriate, reduce backend work, avoid slow redirects.
- Optimise the LCP image: use the right dimensions, compression and format.
- Do not lazy-load the above-the-fold hero image.
- Use
fetchpriority="high"carefully for the main image when it is truly the priority. - Inline critical CSS only when it meaningfully reduces render delay.
- Reduce JavaScript needed before the first meaningful render.
- Use
font-display: swapor another intentional font strategy.
Images and fonts are frequent culprits. For images, the trade-off is not just “small file good”. Format choice, encoding effort and browser support all matter, which is why we keep a practical decision tree for when AVIF beats WebP and when it does not. For type-heavy pages, web fonts are still one of the easiest performance wins because many sites ship more font files than they use.
INP: does the page respond when touched?
Interaction to Next Paint measures responsiveness. More specifically, it looks at the delay between a user interaction and the next visual update after the browser has processed that interaction.
Interactions include things like:
- clicking a button,
- tapping a menu,
- selecting a checkbox,
- typing into a form field,
- opening an accordion.
INP replaced First Input Delay as a Core Web Vital in 2024. That was a good change. First Input Delay only looked at the first interaction. INP is broader: it considers interactions throughout the page visit and reports a high-latency interaction as the page’s responsiveness score.
Plain English: INP catches pages that look loaded but feel stuck.
You have probably used a page like this. It appears ready. You tap the menu. Nothing happens for half a second. You tap again. Then two things happen at once. That is an INP problem.
Common causes of poor INP
INP is usually a main-thread problem. The browser wants to respond, but JavaScript, rendering work or layout calculation is in the way.
Typical causes include:
- large JavaScript bundles,
- expensive event handlers,
- hydration work on client-rendered apps,
- third-party scripts competing for the main thread,
- long-running tasks after page load,
- complex DOM updates triggered by small interactions,
- layout thrashing, where code repeatedly reads and writes layout values.
Marketing tags, analytics, chat widgets and consent banners can all contribute. This does not mean “remove everything”. It means every script on the page has a cost, and interaction latency is where that cost often becomes visible.
How to improve INP
Improving INP is less about one magic attribute and more about reducing main-thread contention.
Useful approaches include:
- Break long JavaScript tasks into smaller chunks.
- Defer non-essential work until after the page is usable.
- Remove unused JavaScript rather than merely minifying it.
- Keep event handlers small and predictable.
- Avoid re-rendering large parts of the interface for tiny state changes.
- Use CSS for simple visual states where possible.
- Audit third-party scripts and load them only where needed.
Also look at interaction design. A button that gives immediate visual feedback can feel more responsive, even if follow-up work takes longer. That is not a substitute for performance, but it is part of good interface engineering. Our checklist for accessible web buttons overlaps with this: clear states, proper semantics and predictable behaviour help both users and browsers.
CLS: does the page stay where the user expects?
Cumulative Layout Shift measures unexpected movement of visible elements. If a user starts reading a paragraph and an ad, image or banner loads above it, pushing the text down, that contributes to CLS.
CLS is not measured in seconds. It is a score based on how much content moved and how far it moved. Lower is better.
The key word is unexpected. Layout changes caused by a user action are usually not counted in the same way. If someone taps “show more” and content expands, that is expected. If a newsletter banner appears at the top after three seconds and pushes everything down, that is not.
Common causes of poor CLS
CLS failures are often mundane:
- images without width and height attributes,
- ads or embeds without reserved space,
- cookie banners inserted above content,
- web fonts swapping in with different metrics,
- late-loading promotional bars,
- dynamically injected content near the top of the page.
The fix is usually to reserve space before the content arrives. The browser should know the shape of the page as early as possible.
How to improve CLS
Start with the visible shifts. Watch a recording or use browser tooling to identify which elements move.
Then apply the boring fixes:
- Add explicit
widthandheightattributes to images. - Use CSS
aspect-ratiofor responsive media containers. - Reserve fixed or minimum space for ads, embeds and iframes.
- Avoid injecting banners above existing content after load.
- Choose font fallbacks with similar metrics to the final font.
- Avoid animations that change layout properties like
top,left,widthorheight; prefer transforms.
CLS is one of the few performance metrics where discipline beats cleverness. If the page has stable boxes, it tends to score well.
Field data and lab data are both useful, but they answer different questions
A common source of confusion is that different tools show different numbers. That is normal.
Field data comes from real users. It reflects actual devices, networks, locations and browser conditions. Google’s Chrome User Experience Report is an example of field data.
Lab data comes from a controlled test environment. Lighthouse is the familiar example. It is repeatable and useful for debugging, but it is not the same as your users’ lived experience.
Use field data to decide whether users have a real problem. Use lab data to reproduce and debug that problem.
Also remember that Core Web Vitals are usually assessed per URL or URL group, not as a single abstract property of your brand. Your home page, blog article, pricing page and checkout can have very different bottlenecks.
A sensible order of work
If all three metrics are poor, the temptation is to start everywhere. Resist that.
A practical order is:
- Fix obvious CLS first
Missing image dimensions and unstable banners are often quick wins.
- Improve LCP for important templates
Focus on pages that matter: product pages, landing pages, articles, sign-up flows.
- Investigate INP with real interactions
Click the things users actually click. Menus, filters, forms and checkout controls often reveal more than the initial load trace.
- Audit third-party scripts
Keep the ones that justify their cost. Remove or delay the ones that do not.
- Set a performance budget
Without a budget, performance improvements decay. New scripts, images and design components will quietly undo the work.
The important point: do not optimise for a badge. Optimise for the user journey. A marginal score improvement on a low-traffic page may matter less than a slightly imperfect but much faster checkout interaction.
<!-- tool-cta:start -->
💡 Try this: Since LCP is usually an image problem, shrink your hero asset with the Image Compressor as a first, easy win.
<!-- tool-cta:end -->
What Core Web Vitals do not tell you
Core Web Vitals are useful, but incomplete.
They do not tell you whether your content is good. They do not tell you whether your navigation makes sense. They do not guarantee accessibility. They do not measure privacy, security, trust, readability or whether the page answers the user’s question.
They also do not replace judgment. A page can pass Core Web Vitals and still be unpleasant. A complex application can miss a threshold while still being responsibly engineered for its constraints.
Treat LCP, INP and CLS as smoke alarms. When they go off, investigate. When they are quiet, keep maintaining the building.
Frequently asked questions
Are Core Web Vitals a Google ranking factor?
What is the difference between LCP and page load time?
Why did INP replace FID?
Can a page have good Lighthouse scores but poor Core Web Vitals?
Which Core Web Vital should I fix first?
Sources & further reading