A small toolkit for debugging redirects and HTTP headers in production
Five command-line tools and browser techniques that show you what's actually happening between client and server
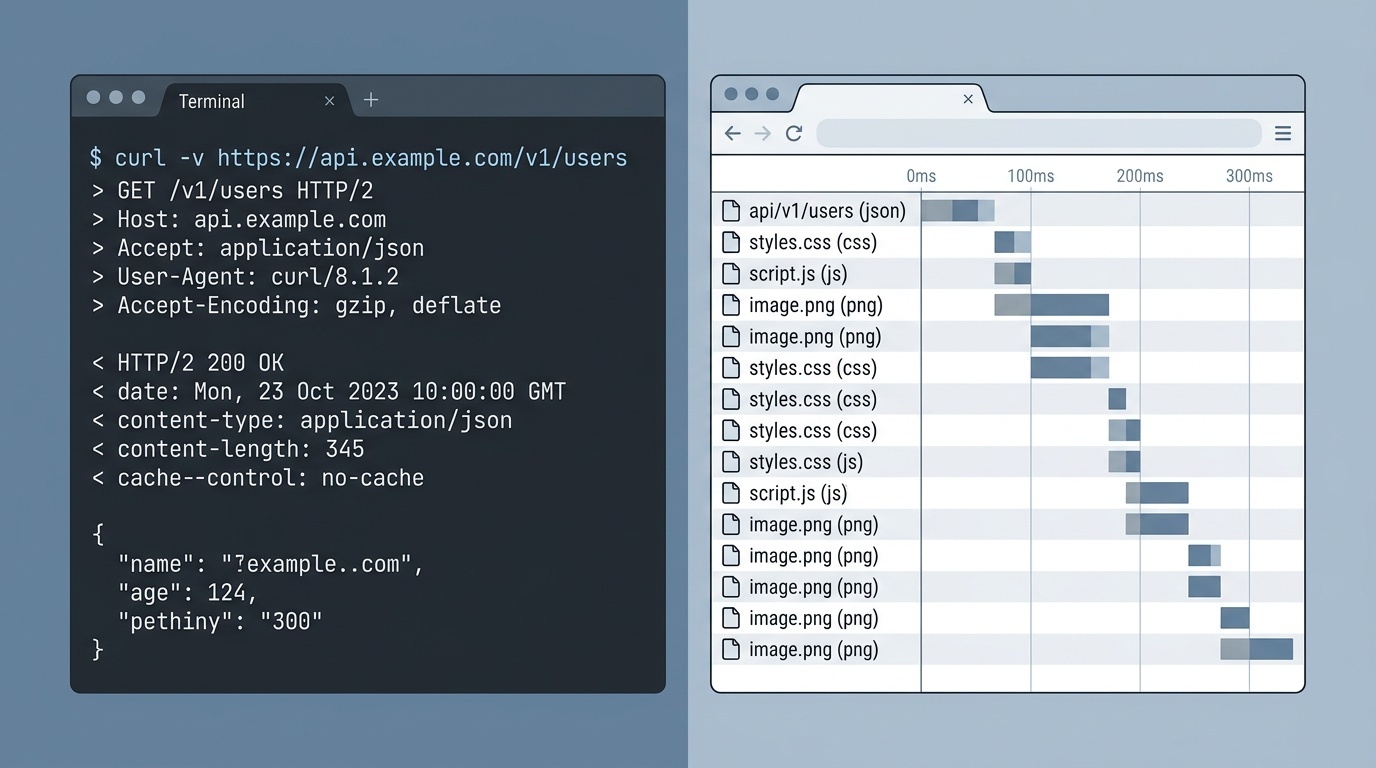
Table of contents
The problem with debugging HTTP in production
Most HTTP problems are invisible in the browser. A redirect chain fails silently, a cache header is wrong by one character, a CORS policy blocks a request without explanation. The browser's developer tools show you the result of the conversation, but they often hide the raw exchange that caused the problem.
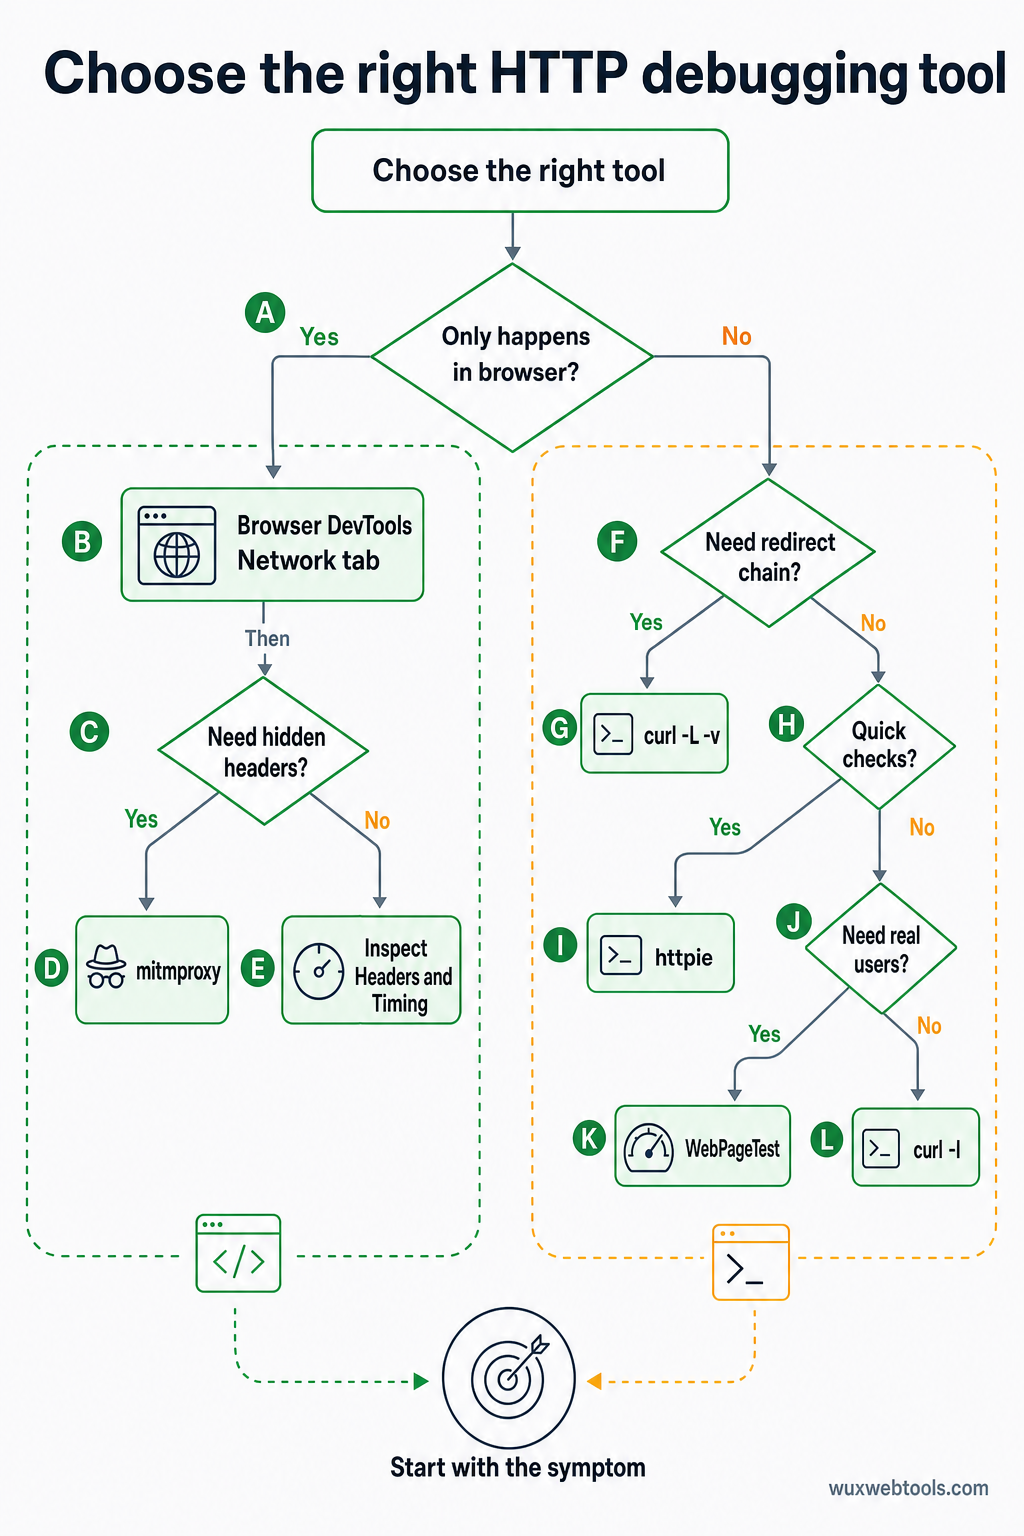
This matters most in production, where you can't add logging or restart services to see what changed. You need tools that show you the actual HTTP conversation: request headers, response headers, status codes, redirect targets, timing. Here are the five tools that do that job reliably, plus the browser techniques that complement them.
curl: the foundation
curl is the first tool to reach for because it shows you exactly what the server sent, with no browser interpretation in between.
To see response headers without the body:
curl -I https://example.comTo follow redirects and see each step:
curl -L -v https://example.comThe -v flag (verbose) shows the full request and response, including all headers. The -L flag follows redirects automatically. Together, they show you the entire redirect chain, which is where most production problems live.
To see only the redirect locations:
curl -s -o /dev/null -w "%{http_code} %{redirect_url}\n" -L https://example.comThis is useful when you need to verify a redirect chain without the noise of full headers. The -w flag formats the output to show only the status code and the next URL in the chain.
curl also lets you send custom headers, which is essential for testing CDN behavior, authentication, or API endpoints:
curl -H "Authorization: Bearer token" -H "Accept: application/json" https://api.example.comhttpie: curl with better defaults
httpie is a Python tool that does what curl does, but with syntax that's easier to remember and output that's easier to read. It's not a replacement—curl is more powerful and more widely installed—but for quick checks, httpie is faster.
To see headers:
http HEAD https://example.comTo follow redirects:
http --follow --all https://example.comThe --all flag shows every response in the redirect chain, not just the final one. This is the equivalent of curl -L -v, but the output is color-coded and easier to scan.
To send JSON:
http POST https://api.example.com name=valuehttpie assumes JSON by default, which saves typing when you're testing APIs. It also pretty-prints the response, which makes it easier to spot malformed headers or unexpected values.
Browser DevTools: Network tab
The browser's Network tab is where you should start if the problem only happens in the browser. It shows you the same information as curl, but it also shows you the browser's interpretation: whether it blocked a request, how it handled caching, whether it sent cookies.
To see the full request and response headers, click on any request in the Network tab, then look at the Headers section. The "Raw" view shows the headers exactly as they were sent, with no formatting.
To see redirect chains, look for requests with 3xx status codes. The browser groups them under the final request, but you can expand them to see each step. This is where you'll find redirect loops, missing Location headers, or redirects that point to the wrong domain.
To see timing, look at the Timing tab for any request. This shows you how long the browser spent on DNS lookup, TCP connection, TLS handshake, and waiting for the server. If a redirect is slow, the timing tab tells you whether the problem is network latency or server processing.
One limitation: the browser hides some headers for security reasons. Set-Cookie headers are visible, but the actual cookie values are redacted. Authorization headers are sometimes hidden entirely. If you need to see those, use curl.
mitmproxy: the intercepting proxy
mitmproxy is a Python tool that sits between your browser and the server, showing you every request and response in real time. It's more complex than curl, but it's the only tool that shows you what the browser actually sends, including headers the browser adds automatically.
To start it:
mitmproxyThen configure your browser to use localhost:8080 as an HTTP proxy. mitmproxy will show you every request in a terminal interface. You can inspect headers, edit requests before they're sent, or replay requests with different parameters.
This is useful for debugging problems that only happen in the browser: CORS preflight requests, cookie handling, or requests that fail when certain headers are present. It's also useful for testing how your site behaves behind a corporate proxy or VPN, because mitmproxy can simulate those environments.
The downside is setup complexity. You need to install a root certificate so mitmproxy can intercept HTTPS traffic, and you need to configure your browser to use the proxy. For quick checks, curl is faster. For deep debugging, mitmproxy is worth the setup time.
webpagetest: production perspective
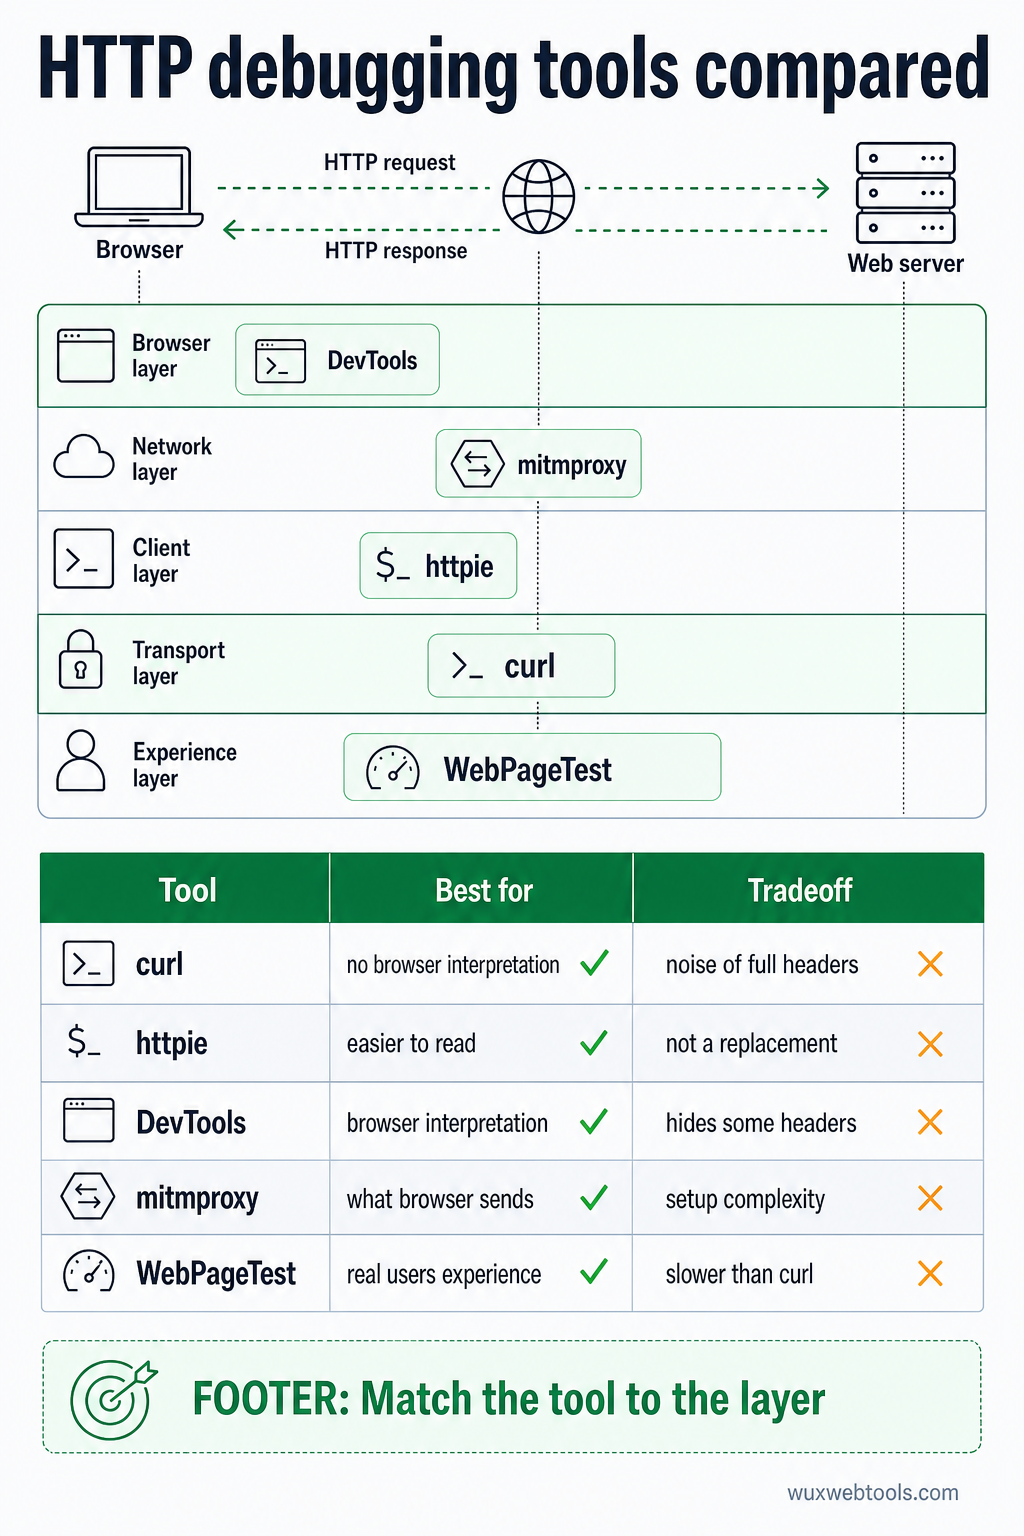
WebPageTest is a free service that loads your page from real browsers in different locations and shows you the full HTTP conversation. It's slower than curl, but it shows you what real users experience, including CDN behavior, DNS resolution, and TLS negotiation.
The "Request Headers" and "Response Headers" views show you exactly what the browser sent and received. The "Waterfall" view shows you the timing of every request, including redirects. This is where you'll find problems that only happen in certain regions or on certain networks.
WebPageTest also shows you the redirect chain for the main document, which is where most redirect problems live. If your site redirects from http:// to https://, then from www. to non-www., then from / to /en/, WebPageTest shows you all three steps and how long each one took.
For tools that help you validate and optimize these HTTP fundamentals, Wux Webtools offers several utilities that run entirely in your browser, including header analyzers and redirect checkers that respect your privacy by processing everything client-side.
When headers lie
The hardest HTTP problems are the ones where the server sends contradictory headers. A Cache-Control header says no-cache, but an Expires header says the resource is valid for a year. A Location header points to a relative URL, but the Content-Location header points somewhere else. The browser has to guess which one to trust, and different browsers guess differently.
When this happens, you need to see the raw headers in the order the server sent them. curl -v does this. So does mitmproxy. The browser's DevTools sometimes reorder headers for readability, which hides the problem.
Another common issue: headers that are added by a CDN or load balancer, not by your application. If you're debugging a caching problem, you need to know whether the Cache-Control header came from your app or from the CDN. curl shows you the final result, but it doesn't tell you where each header came from. For that, you need to bypass the CDN (by hitting the origin server directly) and compare the headers.
The redirect loop problem
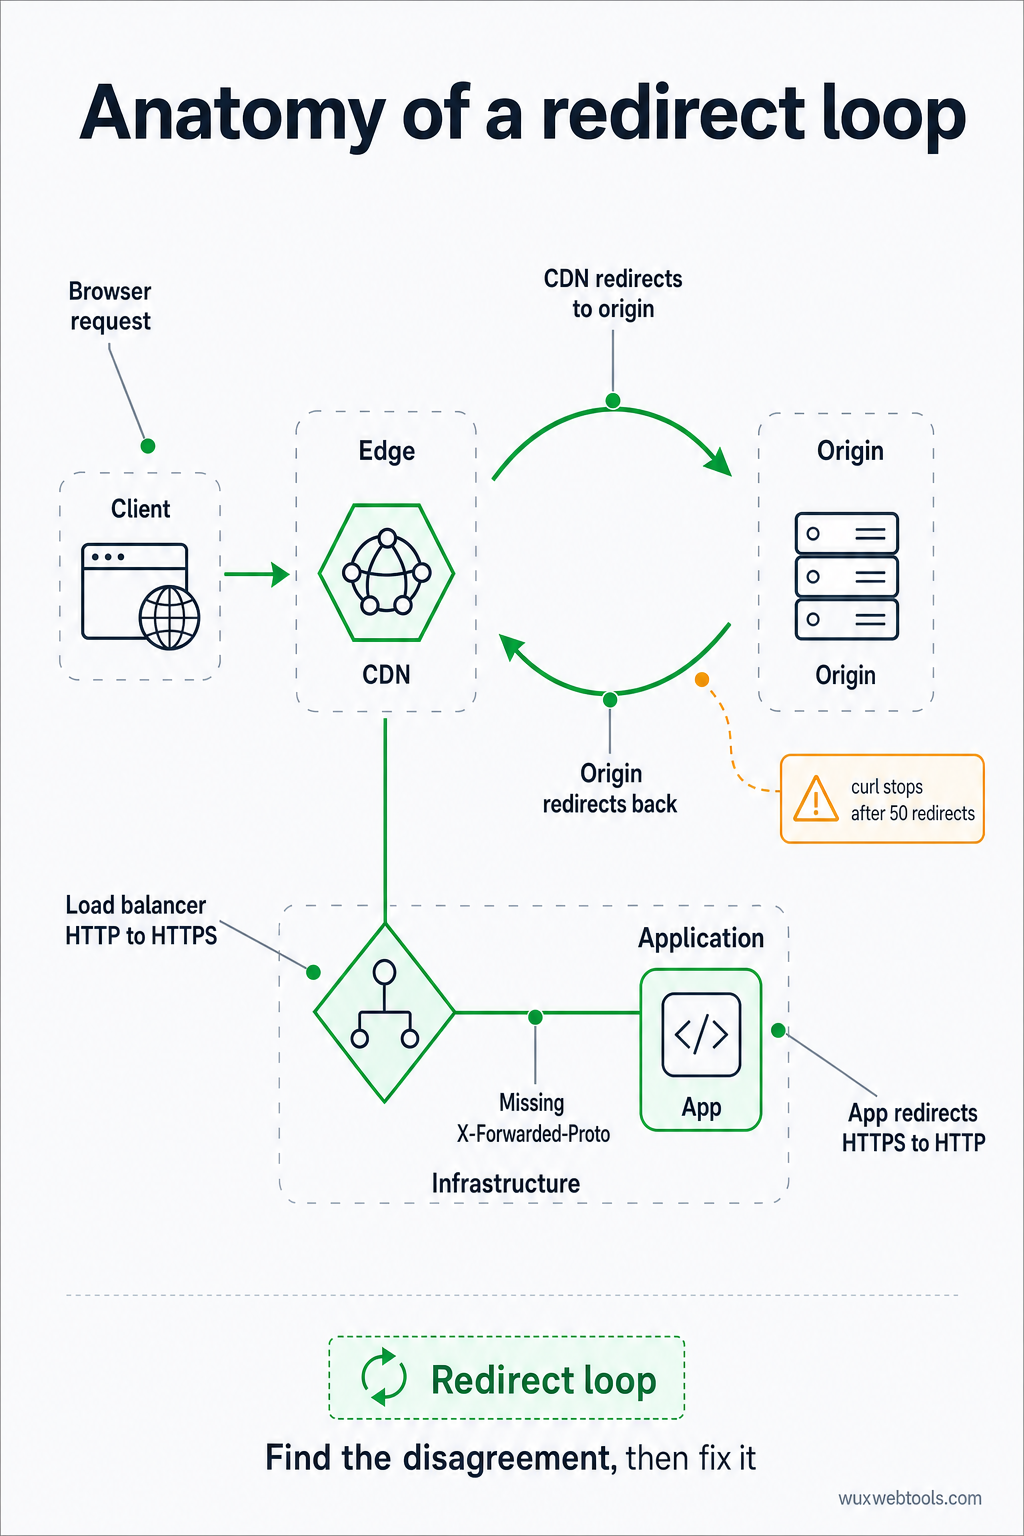
Redirect loops are the most common HTTP problem in production. They happen when two servers disagree about where a URL should point: the CDN redirects to the origin, the origin redirects back to the CDN. Or the load balancer redirects HTTP to HTTPS, but the app redirects HTTPS back to HTTP because it doesn't see the X-Forwarded-Proto header.
To debug this, you need to see the full redirect chain, including the Location header at each step. curl -L -v does this, but it stops after 50 redirects to prevent infinite loops. If you're hitting that limit, you have a redirect loop.
The fix is usually a configuration change: tell the app to trust the X-Forwarded-Proto header, or tell the CDN to stop redirecting requests that are already HTTPS. But you can't fix it until you see the loop, and the browser won't show you more than a few redirects before it gives up.
What to check first
When something breaks in production, check these in order:
- Status code: Is it what you expected? A 301 is permanent, a 302 is temporary, a 307 preserves the HTTP method. If you're seeing the wrong code, the problem is in your redirect configuration.
- Location header: Does it point to the right place? Is it an absolute URL or a relative one? Relative URLs are resolved against the current URL, which can produce unexpected results if the base URL isn't what you think it is.
- Cache headers: Is the browser caching the redirect? A 301 redirect is cached by default, which means a misconfigured redirect can break your site for hours even after you fix it. Check the
Cache-ControlandExpiresheaders to see how long the browser will remember the redirect.
- CORS headers: If the request is cross-origin, does the server send the right
Access-Control-Allow-Originheader? If not, the browser will block the request, and you'll see a CORS error in the console. The server's response headers are the only place to fix this—you can't work around it in the browser.
- Timing: How long did the request take? If it's slow, is it network latency or server processing? The browser's DevTools and WebPageTest both show you timing breakdowns that tell you where the time went.
For a deeper look at how browser behavior has shifted around privacy and headers, see what changed for cookies in 2026 and what to do about it, which covers the header and consent implications of recent browser updates.
Key takeaways
curl -L -vshows you the full redirect chain and all headers, with no browser interpretation- The browser's Network tab shows you what the browser did with the response, including caching and CORS decisions
mitmproxyshows you what the browser sent, including headers the browser adds automatically- WebPageTest shows you what real users experience, including CDN behavior and regional differences
- Redirect loops and contradictory headers are the most common production problems, and they're invisible without raw HTTP inspection
FAQ
Q: Why does curl show different headers than the browser?
A: Because the browser adds headers automatically (User-Agent, Accept, Cookie) and follows its own rules for caching and CORS. curl sends only what you tell it to send. To see what the browser actually sends, use mitmproxy or the browser's DevTools.
Q: How do I debug a redirect that only happens for some users?
A: Check whether the redirect depends on headers the user sends: User-Agent, Accept-Language, Cookie, or IP address (via X-Forwarded-For). Use curl to send the same headers the user sent, or use WebPageTest to load the page from the user's location.
Q: What's the difference between 301 and 302 redirects?
A: A 301 is permanent and tells the browser to cache the redirect (sometimes forever). A 302 is temporary and tells the browser not to cache it. If you're not sure which to use, use 302—you can always change it to 301 later.
Q: Why does my redirect work in curl but not in the browser?
A: Probably because the browser is caching an old redirect, or because the browser is blocking the redirect due to CORS or mixed content rules. Check the browser's DevTools console for errors, and check the Cache-Control headers to see if the browser is using a cached response.
Q: How do I see the headers a CDN adds?
A: Use curl to hit the CDN URL, then use curl again to hit the origin server directly (bypassing the CDN). Compare the headers. The ones that only appear in the first response came from the CDN.
<!-- tool-cta:start -->
💡 Try this: When chasing redirect issues, the Redirect Checker traces the full chain and shows the status codes and headers at each hop.
<!-- tool-cta:end -->
Sources
- curl documentation — Official reference for curl command-line options and behavior
- HTTPie documentation — Guide to httpie syntax and features
- MDN Web Docs: HTTP redirections — Comprehensive explanation of HTTP redirect status codes and behavior
- WebPageTest documentation — How to interpret WebPageTest results and headers
Frequently asked questions
Why does curl show different headers than the browser?
How do I debug a redirect that only happens for some users?
What's the difference between 301 and 302 redirects?
Why does my redirect work in curl but not in the browser?
How do I see the headers a CDN adds?
Sources & further reading